Jump to…
Research Series
What Google Local Services Ads Actually Cost in 2026: A National Benchmark for Home Service Contractors
Brett Williamson, Founder & CEO of Ad Genius | adgenius.com
Google Local Services Ads (GLSA) are the pay-per-lead ads at the very top of Google’s local results, the ones with the Google Verified badge. For most home service contractors, they are the cheapest qualified lead in paid search. They are also widely misquoted. The numbers that circulate online are often a winter snapshot, an average skewed by a few expensive accounts, or a figure that cannot be traced back to anyone who measured it.
So we rebuilt the benchmark from the ground up. We reviewed more than 60 sources, kept only figures we could trace to an original measurement, and checked every one against its source. The result is the most complete public picture we know of for what GLSA leads cost in 2026, and what those leads are actually worth.
At a Glance
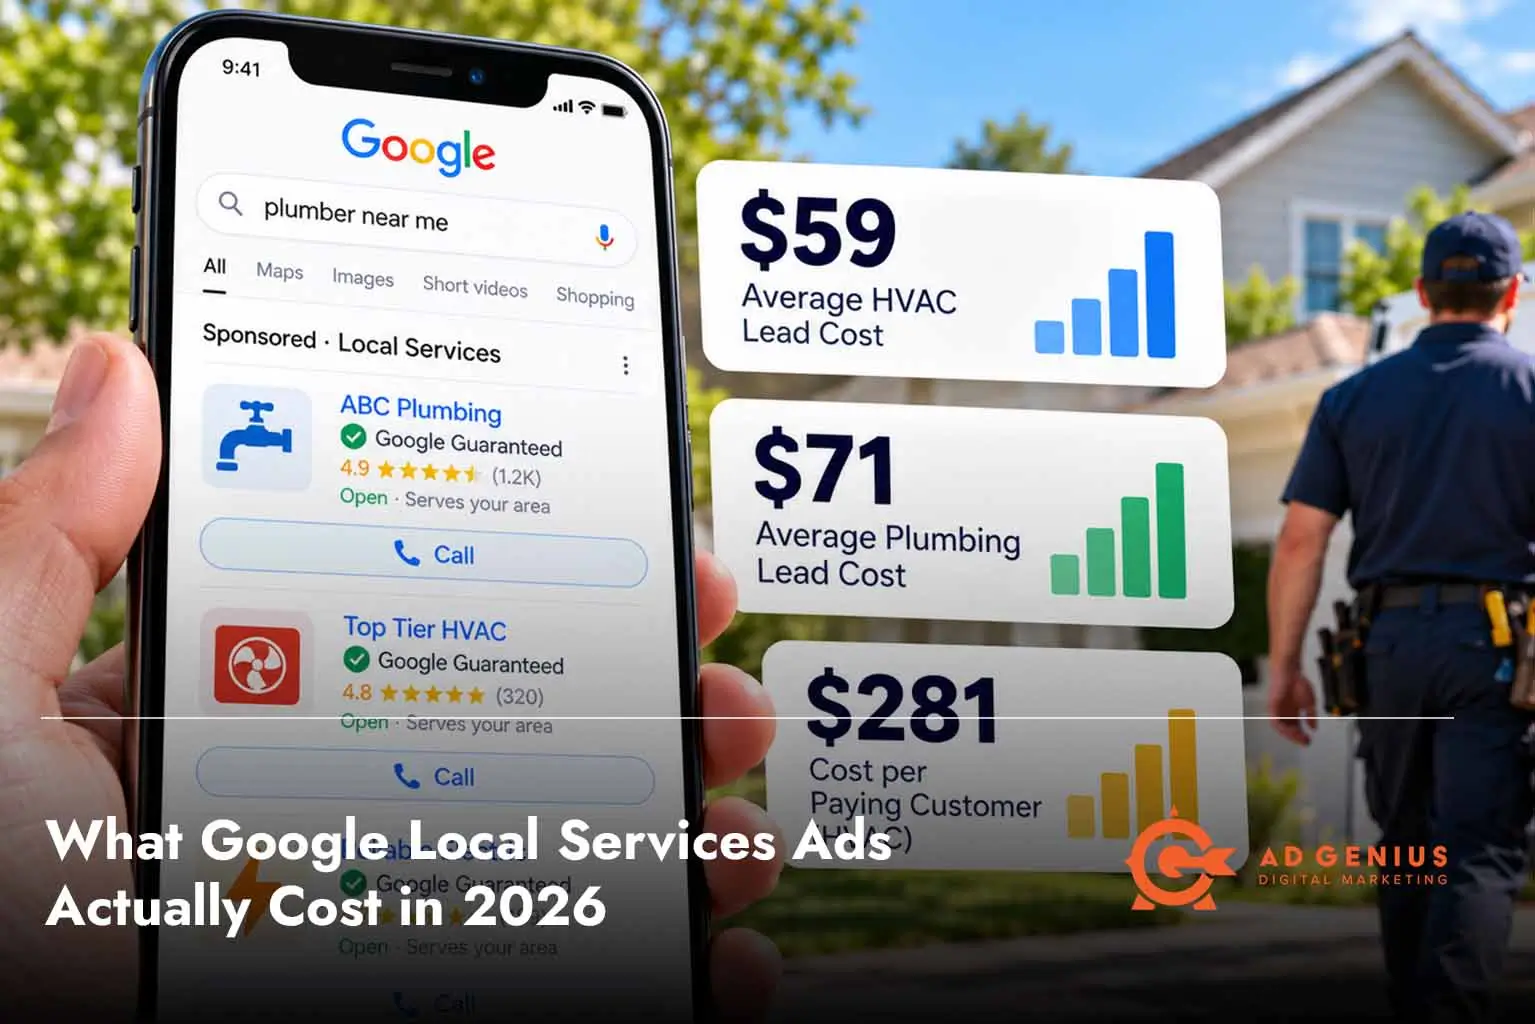
- The typical HVAC lead cost $59 in June 2026. Most HVAC accounts paid between $36 and $85. Plumbing ran higher: $71, with most accounts between $43 and $95. Electrical was the cheapest core trade at about $49.
- A lead is not a customer. Only about one in five GLSA leads becomes a paying customer, so the real acquisition cost runs 4 to 5 times the lead price: $281 per paying customer for HVAC and $319 for plumbing.
- Roofing is the outlier. In first-quarter data, a paying roofing customer cost roughly 9 times the lead price, largely because most of the value was still sitting in open estimates.
- Where you operate matters as much as your trade. Leads averaged $85 in the West and $62 in the Midwest and Northeast. Among states with at least 1,000 leads, costs ranged from $53 in Wisconsin to $89 in Washington.
- GLSA is the cheapest way to buy a new-customer lead in every region. GLSA leads cost a third to half as much as non-branded Google Ads leads in every U.S. region in the first quarter of 2026.
- Costs rose through 2026. The average GLSA lead climbed from $53 in February to $62.56 in June, up 18%, and cost per paying customer rose 30%. Winter and fall leads, however, cost slightly less than a year earlier.
- The booking desk is the biggest lever after the bid. Top-performing contractors book 62% of inbound lead calls from all sources. Everyone else books 39%.
- Reviews buy volume. Contractors with 300 or more Google reviews generated about 11 times as many GLSA leads a year as those with fewer than 100.
How We Built This Benchmark
No single dataset answers what GLSA leads cost. So we assembled the benchmark from every credible measurement we could find, then held each one to the same standard.
How to Read the Numbers
- Cost per lead: what Google charged for a call, message, or booking. Some datasets count unique leads, removing repeat callers, so their figures run slightly higher.
- Typical (median): the middle account. Half paid less, half paid more. We use the median rather than the average wherever possible, because a few expensive accounts can pull an average far off.
- Low and high: usually the 10th and 90th percentiles, so 80% of accounts fall between them. Where a source published a different spread, the table says so.
- Booking rate: the share of leads that turn into a scheduled appointment.
- Cost per paying customer: total spend divided by leads that became paying customers. This is the number that tells you whether GLSA makes money.
- Closed return on ad spend: closed revenue divided by GLSA spend. Pipeline return also counts estimates not yet won, so it always runs higher.
- Sample size: listed for every figure. Small samples are labeled and should be read as directional.
What GLSA Leads Cost by Trade
HVAC, plumbing, and electrical contractors now pay $49 to $71 for a typical lead, and roofing and restoration pay far more. The table below covers the trades with the strongest samples.
GLSA Cost Per Lead by Trade (larger samples)
| Trade | Low | Typical | High | How the range is built | Sample | Period |
|---|---|---|---|---|---|---|
| HVAC | $36 | $59 | $85 | 10th percentile, median, 90th percentile | HVAC accounts within 945 businesses | June 2026 |
| Plumbing | $43 | $71 | $95 | 10th percentile, median, 90th percentile | Plumbing accounts within 945 businesses | June 2026 |
| Electrical | $39 | $49 | $68 | Winter average, June average, 90th percentile | 93 accounts (June); 112 (February); 7 campaigns (high) | Feb to Sep 2026 |
| Roofing | $85 | $129 | $151 | 10th percentile, median, 90th percentile | 12 campaigns | Jun to Sep 2026 |
| Painting | $36 | $44 | $49 | 10th percentile, median, 90th percentile | 14 campaigns | Jun to Sep 2026 |
| Garage door | $26 | $42 | $53 | 25th percentile, median, 75th percentile | 12 contractors, 2,494 leads | Jan to Apr 2026 |
| Handyman | $29 | $35 | $44 | 25th percentile, median, 75th percentile | 24 accounts, 6,396 leads | Jan to Dec 2025 |
| Water damage | $87 | $99 | $278 | 10th percentile, median, 90th percentile | 9 campaigns | Jun to Sep 2026 |
A few patterns stand out. Plumbing runs above HVAC at every point in the range: $7 higher at the low end, $12 at the median, and $10 at the high end. Painting is the most predictable of the larger-sample trades, with a range only $13 wide. Water damage has the longest tail in the table, with the most expensive 10% of accounts paying nearly three times the median.
The job matters as much as the trade. Within plumbing, drain and sewer leads booked at 39.5%, the lowest rate among plumbing job types with more than a couple of accounts behind them, so a plumber whose calls lean toward drain work pays more for each booked job.
Trades With Smaller Samples
These figures come from real billing data but from only a handful of accounts, so read them as directional. Small samples can move 20% or more within weeks.
| Trade | Low | Typical | High | Sample | Period |
|---|---|---|---|---|---|
| Tree services | $39 | $59 | $83 | 5 campaigns | Jun to Sep 2026 |
| Landscaping | $50 | $64 | $67 | 3 campaigns | Jun to Sep 2026 |
| Junk removal | $44 | $71 | $89 | 4 campaigns | Jun to Sep 2026 |
| Carpet cleaning | $32 | $34 | $61 | 5 campaigns | Jun to Sep 2026 |
| Pressure washing | $22 | $40 | $52 | 3 campaigns | Jun to Aug 2026 |
| General contractor | $28 | $56 | $137 | 3 campaigns | Jun to Sep 2026 |
| Moving | $61 | $75 | $89 | 2 accounts, 2,927 leads | 2021 to 2026 |
| Pool builder | $42 | $49 | $56 | 2 accounts, 248 leads | 2021 to 2026 |
| Solar | $105 | $120 | $135 | 2 accounts, 127 leads | 2021 to 2026 |
For the last three rows, low and high are the lowest and highest account in the sample, not percentiles. Several eligible categories, including carpenters, home theater, and snow removal, have no published GLSA data we could verify, so they are not listed.
The Number That Matters: Cost per Paying Customer
A $59 lead is not a $59 customer. Across the largest datasets, roughly one in five GLSA leads became a paying customer. The rest never turned into paid work.
Cost Per Lead vs. Cost Per Paying Customer
| Trade | Cost per lead | Cost per paying customer | Multiple | Closed return on ad spend | Sample and period |
|---|---|---|---|---|---|
| All home service trades | $62.56 | $302.33 | 4.8x | 7.0x median | 945 businesses, June 2026 |
| HVAC | $59 | $281 | 4.8x | 8.1x | June 2026 |
| Plumbing | $71 | $319 | 4.5x | 6.2x | June 2026 |
| Electrical | $43.84 | $217.81 | 5.0x | 6.1x (June) | March 2026 |
| Garage door | $49 | $198 | 4.0x | 5.78x | 12 contractors, Jan to Apr 2026 |
| Roofing | $79 | About $731 (calculated) | 9.3x | 4.82x | 10 contractors, Q1 2026 |
The spread inside each trade is wide. The middle 80% of HVAC accounts paid anywhere from $129 to $716 per paying customer; plumbing ran $170 to $591. Within that middle band, the costliest HVAC accounts paid more than five times as much per customer as the most efficient. Much of that difference is decided after the phone rings.
Roofing needs its own lens. In first-quarter data from 10 roofing contractors, 1,218 leads produced 479 booked appointments but only 131 paying customers by the end of the quarter. Closed return on ad spend was 4.82x, while pipeline return, which counts estimates still open, was 33.58x. Roofing economics cannot be judged on the same short timeline as an emergency plumbing call.
Tickets explain part of the gap between trades. HVAC produced the highest average closed ticket in the data, $2,858 in June. Plumbing and electrical averaged about $1,700 in March, and garage door $1,145.
For how GLSA fits alongside Google Ads and SEO in a full HVAC budget, see what HVAC marketing costs and what it should produce
What this means for you: judge GLSA on cost per paying customer, not cost per lead. If your reporting stops at leads, you cannot tell whether the channel is making you money.
Where You Operate: Regional and State Costs
Location moves GLSA prices as much as trade does. In June 2026, across all home service trades, a lead in the West cost 37% more than the same lead in the Midwest or Northeast.
GLSA Cost Per Lead by Region (June 2026, all home service trades)
| Region | Cost per lead | Leads in sample |
|---|---|---|
| West | $85 | 7,970 |
| Southwest | $72 | 9,082 |
| Southeast | $72 | 14,791 |
| Northeast | $62 | 8,085 |
| Midwest | $62 | 15,722 |
| National | $70 | 55,650 |
These are average costs per unique lead across all trades, mapped by zip code. They come from a different sample than the trade tables and run higher than the trade medians above. Use them to compare places, not to price a single trade.
GLSA Cost Per Lead by State (June 2026, states with 1,000 or more leads)
| State | Cost per lead | Leads |
|---|---|---|
| Washington | $89 | 1,299 |
| Colorado | $87 | 1,962 |
| Arizona | $84 | 2,076 |
| South Carolina | $84 | 1,657 |
| Florida | $81 | 4,615 |
| California | $78 | 2,530 |
| North Carolina | $78 | 1,723 |
| Indiana | $75 | 1,717 |
| Texas | $72 | 4,456 |
| Minnesota | $70 | 1,670 |
| Georgia | $68 | 1,416 |
| Ohio | $67 | 4,173 |
| New Jersey | $65 | 2,001 |
| Missouri | $64 | 1,538 |
| Pennsylvania | $64 | 1,746 |
| Tennessee | $64 | 1,368 |
| Oklahoma | $61 | 1,083 |
| Illinois | $59 | 1,028 |
| Virginia | $58 | 1,781 |
| Michigan | $57 | 2,707 |
| New York | $54 | 1,652 |
| Wisconsin | $53 | 1,559 |
Utah posted the highest cost of any state with a meaningful sample, $128 per lead on 746 leads. We left states with fewer than 1,000 leads out of the table because a handful of accounts can swing them.
GLSA vs. Google Ads, Region by Region
Even where GLSA is expensive, it is still the cheaper way to buy a new-customer lead. In the first quarter of 2026, GLSA leads cost a third to half as much as non-branded Google Ads leads in every region.
Cost Per Lead, First Quarter 2026
| Region | GLSA | Non-branded Google Ads | GLSA as share of non-branded |
|---|---|---|---|
| West | $73 | $204 | 36% |
| Southwest | $63 | $205 | 31% |
| Southeast | $59 | $187 | 32% |
| Northeast | $57 | $167 | 34% |
| Midwest | $56 | $109 | 51% |
Branded Google Ads, meaning searches for your own company name, cost less still, $33 to $56 a lead. But branded search only reaches people who already know you. Among Google’s paid options for reaching new customers, GLSA was the lowest-cost lead in every region.
What this means for you: compare your costs to your own region, not a national number. A $70 HVAC lead can be a good result in Arizona and an expensive one in Michigan.
When You Buy: Seasonality and the 2026 Trend
GLSA costs rose steadily through the first half of 2026. The same platform’s data shows the average lead climbing 18% from February to June, and the cost of each paying customer rising faster.
Average GLSA Cost, All Home Service Trades
| Month (2026) | Cost per lead | Cost per paying customer | Businesses in sample |
|---|---|---|---|
| February | $53.00 | $233.00 | 888 |
| March (1st to 25th) | $55.08 | $262.78 | 760 |
| May | $63.29 | $315.52 | 1,011 |
| June | $62.56 | $302.33 | 945 |
| August | About $67 (calculated) | Not published | 916 |
The August figure is our calculation from published totals: $13.08 million in spend across 194,460 unique leads. The same method applied to June lands within a dime of the published figure.
The regional data tells the same story. Every region’s cost per lead rose between March and June, from 11% in the Northeast to 24% in the Southeast.
Off-Season Leads Got Cheaper
Here is the counterintuitive part. In the same platform’s year-over-year comparisons, winter and fall leads cost slightly less than a year earlier, and booking rates improved where reported:
- October: $50.40 in 2024, $47.58 in 2025
- December: $55.72 in 2024, $54.05 in 2025
- January: $58.76 in 2025, $55.27 in 2026
Peak season moved the other way. Cost per paying customer in July 2026 was 8.4% higher than in July 2025. The December and January comparisons use contractors with at least a year on the platform, who skew toward larger budgets.
Trade Seasons
HVAC and roofing swing the hardest. In one agency’s client data, roofing leads averaged about $101 in the second quarter and $143 to $151 by late summer. HVAC follows the weather: cooling peaks in hot climates, heating peaks in cold ones.
What this means for you: shoulder months are the cheapest time to build review volume, launch a new GLSA profile, and gather booking data. Budget for peak-season prices before peak season arrives.
What Moves Your Cost
Google ranks GLSA listings on your bid, how likely you are to book the lead, and the quality of your profile, including rating, review count, and responsiveness. The data shows which of those levers matter most.
Reviews Buy Volume, Not Cheaper Leads
In a study of 97 contractor accounts, those with 300 or more Google reviews generated about 674 GLSA leads a year. Those with fewer than 100 reviews generated about 59, about one-eleventh as many. The high-review contractors paid a somewhat higher cost per lead, $105 versus $90. A separate study of 28 handyman accounts found the same volume pattern. A study of law firms showed the same pattern. These are associations, not proof that reviews alone cause the gap, but the volume effect appeared in all three datasets we reviewed.
The Booking Desk Is the Biggest Lever After the Bid
ServiceTitan’s data on its contractor customers found that top performers, the top 10% by revenue in their trade and market, book 62% of their inbound lead calls. Everyone else books 39%. At a $59 HVAC lead, that difference alone moves the cost per booked appointment from about $95 to about $151.
Speed matters too. Jobber’s 2026 Home Service Trends Report found that more than 55% of customers expect a response within the hour, and 28% expect one immediately. In the handyman study, accounts that answered more calls also paid less per lead.
Not Every Lead Can Be Booked
In an August 2026 review of GLSA conversions across about 100 contractors, 43% were graded as unbookable, meaning no one could have turned them into an appointment. Of the remaining conversions that could have been booked, 58% still were not. That second number is the one contractors control.
Google has also narrowed what it credits back. It no longer issues credits for leads outside the job types or service areas you selected, so those settings must match the work you want.
GLSA Has a Ceiling
GLSA volume is capped by how many people in your service area search for your services. Push past that and each extra lead costs more. In the August 2026 data, contractors in each higher spending tier paid more per lead. In garage door data, cost per lead held at $44 to $46 through the first quarter, then jumped 28% in April as spend scaled up.
Two Settings Worth Checking
- Message leads: Google states that message leads typically cost less than phone leads. If your team can answer messages quickly, turning them on can lower your blended cost.
- Budget: Google recommends a budget that supports at least 10 leads per week under Maximize Leads, the setting where Google adjusts your bids automatically. Below that, the system has too little data to work with.
What this means for you: before raising your bid, raise your booking rate, your review count, and your answer rate. Those levers lower your cost per customer without adding a dollar of ad spend.
What Changed in 2026
GLSA changed substantially over the past year. Each of these is confirmed in Google’s own documentation or announcements.
| Date | Change | What it means for contractors |
|---|---|---|
| October 20, 2025 | Google Guaranteed, Google Screened, and License Verified badges replaced by a single Google Verified badge | Marketing that still says “Google Guaranteed” is out of date |
| December 7, 2025 | Consumer money-back guarantee ends for services booked after this date | The badge now signals verification, not a guarantee |
| July 31, 2026 | Google renames and updates its requirements to match the new badge | Check your verification status against the current requirements |
| August 2026 | GLSA begins moving into Google Ads as a pay-per-lead version of Performance Max, Google’s automated campaign type, starting with plumbing, HVAC, electrical, appliance repair, house cleaning, lawn care, roofing, pest control, and moving | Bidding moves to one cost target per campaign, so multi-trade companies need separate campaigns per trade; old performance reports do not carry over |
| October 1, 2026 | Missed calls during business hours are charged as leads when the caller stays on the line more than 20 seconds; repeat calls from the same person within 15 days are charged once | An unanswered phone now costs money directly, not just ranking |
The two changes that hit contractors’ budgets most directly have their own guides: what the Performance Max migration means for your account and how missed-call charges work.
No published study yet shows how performance changes after an account moves to the new campaign type. We will add that data as it appears.
Five Mistakes the Data Exposes
- Judging GLSA on cost per lead. A $59 lead becomes a $281 customer in HVAC. Contractors who cut GLSA because the lead price looks high, or keep it because it looks low, are deciding on the wrong number.
- Comparing yourself to a national average. A West Coast contractor paying $80 may be doing better than a Midwest contractor paying $65. Region, state, and season all move the price.
- Treating a winter number as a year-round number. Many published benchmarks still quote February data. By June, the average lead cost 18% more.
- Leaving the phone to chance. The booking gap between top performers and everyone else is 23 points. From October 1, 2026, an unanswered call during business hours can also be billed as a lead, as we explain in our guide to missed-call charges. Phone coverage is now part of your ad budget.
- Running every trade through one campaign after the migration. The new campaign type sets one cost target per campaign. A company that runs HVAC and plumbing together loses the ability to price each trade on its own economics. Our Performance Max migration guide covers how to set campaigns up before the switch.
Beyond Home Services
The same pattern, cheap-looking leads and expensive customers, shows up outside the trades. Across nine law firms with $1.2 million in GLSA spend, the average lead cost $232 and the average signed case cost $2,525, verified in the firms’ own records. Among 36 dental practices, the typical GLSA lead cost $62, with the middle half of practices paying $47 to $87.
How to Cite This Research
Williamson, Brett. “What Google Local Services Ads Actually Cost in 2026: A National Benchmark for Home Service Contractors.” Ad Genius, Sep 29, 2026, adgenius.com/research/google-local-services-ads-cost-benchmark/.
Journalists and researchers may quote figures from this benchmark with attribution and a link to this page.
Brett Williamson is the Founder and CEO of Ad Genius, a Phoenix-based digital marketing agency specializing in home service and professional service contractors. Ad Genius helps established contractors build the digital infrastructure needed to generate consistent, qualified inbound leads and stop competing on price because buyers can’t find them any other way. adgenius.com